|
Confocal microscope image analysis software used in Vesicular release of glutamate from hippocampal neurons in culture: An immunocytochemical assay In press Experimental Brain Research 2007 You can analyse both single channel images (grayscale or single color) or 3 channel images (RGB) with the software. You can convert confocal microscopy image files to tiff files with ImageJ which can be downloaded here: http://rsb.info.nih.gov/ij/ |
||||
Softwareimagecalc.zip imagecalc.zip contains the software with a threshold.txt text file and folder with sample images. Source codeimagecalc-src.zip DocumentationDownload imagecalc.jar and thresholds.txt. and edit threshold values in the threshold files in notepad copy the folder with the files you want to analyse to the same location as imagecalc.jar and thresholds.txt. run the program in the terminal with the following command: java -jar imagecalc.jar testfiles "testfiles" is the folder containing the images The program analyses all files (in the chosen folder) with the following fileextensions: tif, tiff, png, bmp , jpg use: "java -Xmx1000m -jar imagecalc.jar testfiles" if you analyse large files -Xmx1000m indicates 1 gb memory use for java You can edit the thresholds in the thresholds.txt file. Each line contains a threshold from a low value to a high value with a "," sign in between.. 0,20 counts number of pixels with values from and including 0 to and including 20 21,50 counts number of pixels with values from and including 21 to and including 50 The file can not contain any blank lines before or after the threshold. The results are shown in the terminal window and in addition stored in a file called results.txt. The results.txt is saved in the same location as imagecalc.jar and has results as TAB separated values that can be imported into Excel. Each time you run the program the results are appended to the existing results if the file already exist. If the file does not exist, the program saves the results in a new file. 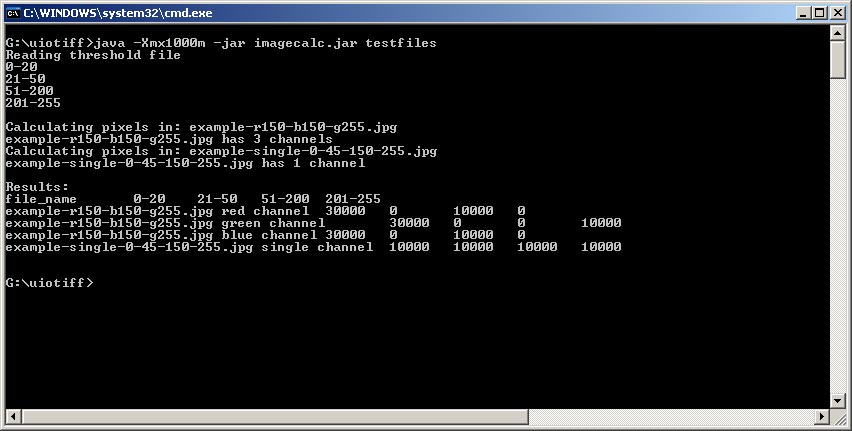
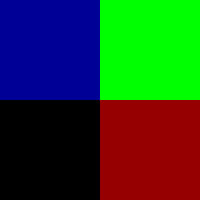
The testfolder in the zip file contains 2 jpg images: The testimages consist of 4 squares. Each square is 100 pixels wide and high The amount of pixels in each square is 10000. example-r150-b150-g255.jpg
example-single-0-45-150-255.jpg
To compile the source you need to download Java Advanced Imaging libs at: https://jai.dev.java.net/binary-builds.html ContactQuestions about the software can be sent to Tomasz Furmanek at : mail@wotansoftware.comThe software has been made in collaboration with: Leif Oltedal, University of Bergen Ricki Sickenger, Sickenger IT solutions Svend Davanger, University of Oslo Camilla Haglerřd, University of Oslo |